Introduction to Location Intelligence
30 Python libraries to harness power of geospatial data 🌎
I find the application of Location Intelligence in business scenarios to be incredibly intriguing. Starting from 2012, I’ve been delving into the realm of Geo Spatial data analytics. I employed a combination of ArcGIS and Python to dissect and portray geographical data as part of my postgraduate studies at Virginia Tech. Since that time, I’ve successfully tackled several business challenges by leveraging these skills.

In this blog post, I will discuss the process of utilizing Geo-Spatial Data within the Python programming environment. The purpose of this article is to address the following :
- Explaining the concept of Location Intelligence
- Grasping the fundamentals of GeoSpatial Data
- Introducing 30 Python libraries designed for Geospatial Data Analysis
What is Location Intelligence?
Location Intelligence refers to the practice of utilizing geographical or spatial data to gain insights, make informed decisions, and solve complex problems. It involves the integration of geographic information systems (GIS), data analytics, and business intelligence to analyze and interpret data in a spatial context.
Location Intelligence goes beyond simple mapping and visualization; it involves the analysis of data with geographic components, such as addresses, coordinates, boundaries, and regions. By incorporating location data into the analysis, businesses and organizations can uncover patterns, relationships, and trends that might not be apparent through traditional data analysis methods.
Here is the brief on Location Intelligence from ESRI.
Understanding GeoSpatial Data
Spatial data, Geospatial data, GIS data or Geo-data, are names for numeric data that identifies the geographical location of a physical object such as a building, a street, a town, a city, a country, etc….. according to a geographic coordinate system.
From the spatial data, you can find out not only the location but also the length, size, area or shape of any object. An example of a kind of spatial data that you can get are: coordinates of an object such as latitude, longitude, and elevation.
Geographic Information Systems (GIS) or other specialized software applications can be used to access, visualize, manipulate and analyze geospatial data. Some examples of geospatial data include:
1. Vectors and Attributes
Points, lines, polygons, and other descriptive information about a location.

Vector data is a representation of a spatial element through its x and y coordinates. The most basic form of vector data is a point. Two or more points form a line, and three or more lines form a polygon.
The simplest form is to include one or more extra columns in the table that defines its geospatial coordinates. More formal encoding formats such as GeoJSON also come in handy.
GeoJSON, an extension to the JSON data format, contains a geometry feature that can be a Point, LineString, Polygon, MultiPoint, MultiLineString, or MultiPolygon.
There are several other libraries available for representing geospatial data that are all described in the Geospatial Data Abstraction Library (GDAL).
2. Point Clouds
Collected by LiDAR systems, they can be used to create 3D models.
3. Raster and Satellite Imagery
Raster data is used when spatial information across an area is observed. It consists of a matrix of rows and columns with some information associated with each cell.
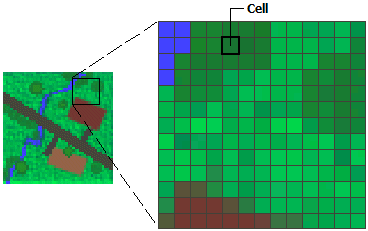
An example of raster data is a satellite image of a nation or a city represented by a matrix that contains the weather information in each of its cells.
There are several ways that you can work with raster data in Python. One recent package that is user-friendly is xarray, which reads netcdf files.
Additional Terminologies
- Shapefile: data file format used to represent items on a map
- Geometry: a vector (generally a column in a dataframe) used to represent points, polygons, and other geometric shapes or locations, usually represented as well-known text (WKT)
- Polygon: an area
- Point: a specific location
- Basemap: the background setting for a map, such as county borders in California
- Projection: since the Earth is a 3D spheroid, chose a method for how an area gets flattened into 2D map, using some coordinate reference system (CRS)
- Colormap: choice of a color palette for rendering data, selected with the ‘cmap’ parameter
- Overplotting: stacking several different plots on top of one another
- Choropleth: using different hues to color polygons, as a way to represent data levels
- Kernel Density Estimation: a data smoothing technique (KDE) that creates contours of shading to represent data levels
- Cartogram: warping the relative area of polygons to represent data levels
- Quantiles: binning data values into a specified number of equal-sized groups
- Voronoi Diagram: dividing an area into polygons such that each polygon contains exactly one generating point and every point in a given polygon is closer to its generating point than to any other; also called a Dirichlet tessellation
30 Python libraries for Geospatial Data Analysis
I have included a full list of 30 Python libraries below: